

Alabama’s typical home is worth $241,517 today, but what a seller actually walks away with depends entirely on which door they choose.
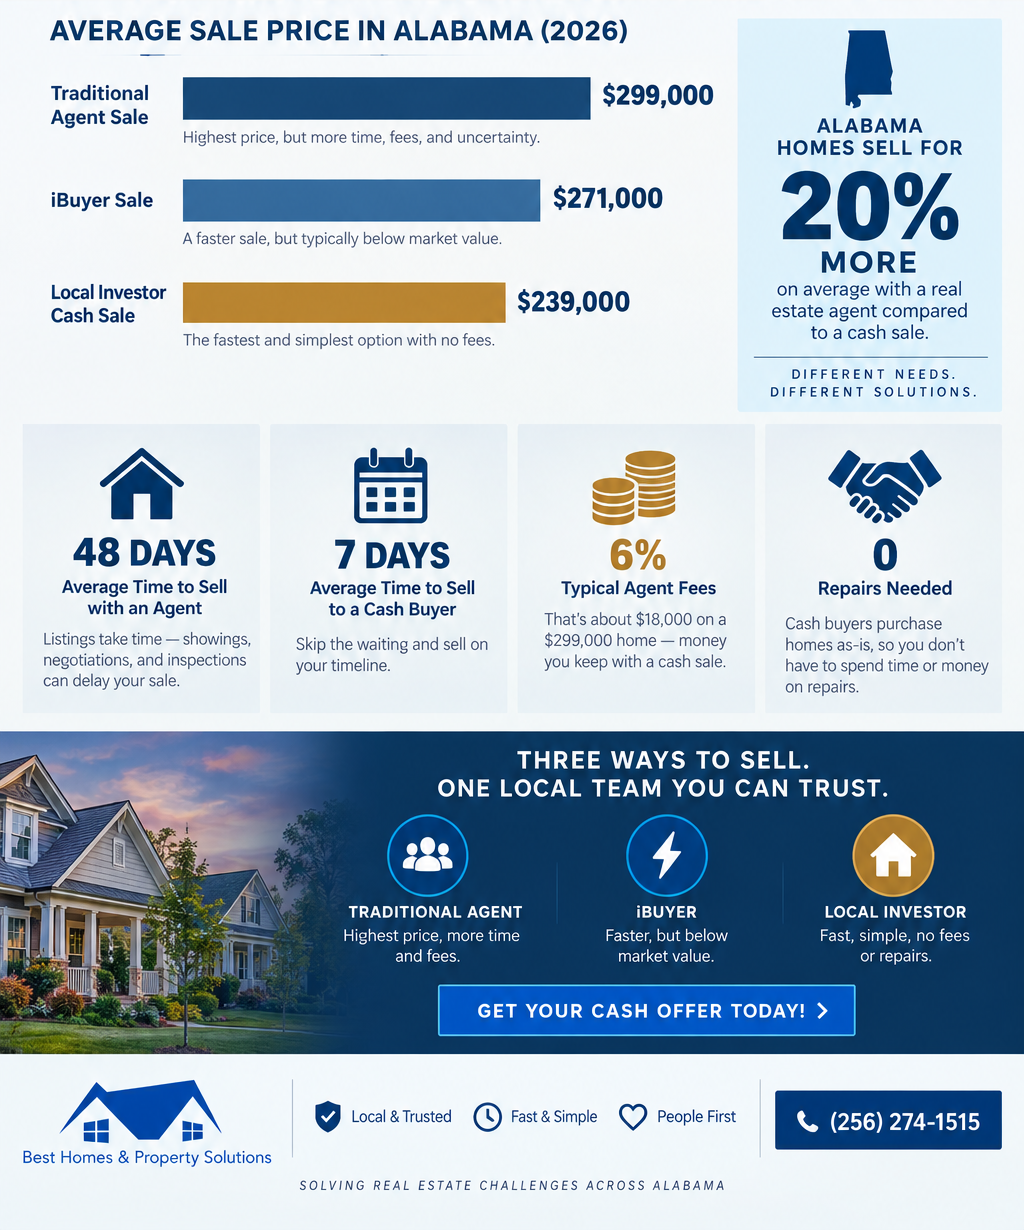
Sell through a traditional agent and the median sale price runs closer to $267,333 — before subtracting commissions, repairs, and weeks of carrying costs. Sell to a cash buyer and the offer typically lands at 50% to 95% of that same value, depending on the type of buyer, but the seller can be holding a check in as little as seven days. Neither path is a scam and neither is automatically the smarter move — they’re solving for different problems. Below is the full 2026 data set on how the two options compare in Alabama, sourced from Census, Zillow, NAR, and RealTrends data.
The Hero Numbers
- Alabama’s typical home value is $241,517, up 1.5% over the past year, with homes going to pending in about 26 days (Zillow, 2026)
- Cash-for-houses investors typically offer 50% to 70% of a home’s fair market value, based on the industry’s standard 70% ARV formula (HomeLight, 2026)
- The national real estate commission averages 5.70% of the sale price in 2026 — in Alabama, average realtor fees run slightly higher at 5.96% (Clever Real Estate, 2026)
- A cash sale can close in 7 to 14 days, compared with 65 to 93 days start-to-finish for a traditional financed sale (Opendoor, 2026)
- FSBO sales trail agent-assisted sales by $65,000 nationally, and only 5% of sellers went the FSBO route in 2025 — a record low (NAR, 2025)
- Alabama sellers paid a median home price of $325,000 by the end of 2025, up from $318,832 at the start of the year (RealTrends, 2025)
- 28% to 29% of all U.S. home purchases were paid in cash as of late 2025, down from a nearly 35% pandemic-era peak (Redfin, 2025)
Alabama’s Home Value Baseline
Before comparing sale paths, it helps to see where Alabama’s market actually sits, because “median home value” shifts depending on which data set is measuring it and when.
The U.S. Census Bureau’s American Community Survey puts Alabama’s median value of owner-occupied housing units at $209,900, based on 2020–2024 five-year estimates — a figure that includes homes that haven’t sold recently and skews lower because it reflects the full owned housing stock, not just active sales. Zillow’s more current Home Value Index, which tracks month-to-month changes across all homes, has Alabama’s typical value at $241,517 as of mid-2026, up 1.5% year-over-year. Meanwhile, RealTrends’ market summary — built from actual closed transactions — shows Alabama’s median sale price ending 2025 at $325,000, up 2% for the year, with an average price per square foot of $186.
Alabama’s homeownership rate sits at 70.2%, well above the national average, and the state’s population has grown 3.3% since the 2020 Census to just over 5.19 million residents — a mix of natural growth and new residents drawn by the state’s lower cost of living. That combination of high ownership and steady in-migration is exactly the environment where both agent-listed sales and cash offers stay active: plenty of owner-occupied inventory, and a buyer pool willing to compete for it.
Source: U.S. Census Bureau QuickFacts (Alabama, 2020-2024 ACS); Zillow Home Value Index (June 2026); RealTrends 2026 Alabama Market Summary
What Selling With an Agent Actually Nets You
Listing with a real estate agent is still how the overwhelming majority of Alabama homes change hands, and NAR’s 2025 Profile of Home Buyers and Sellers confirms why: agent-assisted sellers achieved a median final sale price of 99% of their final list price, and homes sold FSBO fetched $65,000 less on average than comparable agent-assisted sales. Only 5% of U.S. sellers went the FSBO route in 2025, a record low, while 91% used an agent.
That expertise isn’t free, though. The national average real estate commission in 2026 is 5.70% of the sale price, split roughly 2.88% to the listing agent and 2.82% to the buyer’s agent. Alabama runs slightly above that average, with realtor fees typically totaling 5.96% — about 2.96% to the listing side and 3.00% to the buyer’s side. On Alabama’s $325,000 median sale price, that’s roughly $19,370 in commissions alone, on top of seller closing costs that separately average 3.00% of the purchase price (title fees, transfer tax, prorated property taxes, and recording fees).
Timing adds another layer of cost. Alabama’s market started 2025 with a median 91 days on market and ended the year at 84 days — meaning the typical agent-listed Alabama home sat for nearly three months before finding a buyer, and about 34.65% of active listings took at least one price cut along the way. Add the standard 30-to-45-day financed closing period once a buyer is under contract, and a full agent-assisted sale in Alabama commonly runs three to four months from listing to keys changing hands.
Source: NAR 2025 Profile of Home Buyers and Sellers; Clever Real Estate 2026 Commission Survey; RealEstateWitch/ListWithClever Alabama Closing Cost Report (2026); RealTrends 2026 Alabama Market Summary
What a Cash Offer Actually Pays
Cash buyers fall into a few distinct categories, and the discount from market value varies sharply between them. Local “we buy houses” investors and franchise networks generally follow the 70% ARV rule: they’ll pay no more than 70% of a home’s after-repair value, minus estimated repair costs — which in practice means offers commonly land between 50% and 70% of a home’s actual fair market value. Applied to Alabama’s $241,517 typical home value, that 70% ceiling alone works out to roughly $169,000, before any repair-cost deductions bring it lower.
Technology-driven iBuyers occupy a different tier. Because they’re competing on convenience rather than maximum margin, their offers typically range from 85% to 95% of market value — Opendoor’s own industry comparison puts the full spread across all cash-buyer types at 50% to 95% of market value, meaning the gap on a $400,000 home can be the difference between a $200,000 offer and a $360,000 offer. NAR data on iBuyer transactions specifically found that only about 1% of U.S. home sellers used an iBuyer, with contracts typically closing in 30 days, 5% of contracts terminating, and 13% experiencing delays.
For Alabama sellers, this means the “cash offer” umbrella covers a wide range of outcomes, and the type of cash buyer matters as much as the fact that it’s a cash sale at all.
Source: HomeLight 70% Rule Guide (2026); Opendoor “Companies That Buy Houses for Cash” (2026); National Association of Realtors iBuyer data (2022, via HomeLight)
The Speed Equation
Speed is where cash sales earn their reputation, and the data backs it up unambiguously. A financed home purchase typically closes in 30 to 45 days once a buyer is under contract, and the average purchase mortgage nationally took 41 days to close as of mid-2025. Add the time a home spends actively listed — a national median of roughly 36 to 54 days depending on whether NAR’s or Redfin’s measurement method is used — and a typical financed sale runs 65 to 93 days from listing to closed keys.
Cash sales compress that dramatically. Without a lender, appraisal contingency, or financing fall-through risk, cash purchases close in as little as 7 to 14 days, with some “we buy houses” companies closing within a single week. For Alabama sellers facing a foreclosure timeline, a probate deadline, or a job relocation with a hard start date, that four-to-eight-week difference is often the entire reason they’re considering a cash sale in the first place.
Nationally, cash’s overall share of the buying pool has been sliding as mortgage rates ease: 28% to 29% of U.S. home purchases were all-cash as of late 2025, down from a pandemic-era peak near 35% in late 2023, when mortgage rates in the high-7% range pushed buyers toward cash to avoid interest costs.
Source: Opendoor “How Long Does It Take to Sell a House?” (2026); Zillow Mortgage Learning Center (2026); Redfin All-Cash Purchase Report (2025-2026); NAR Realtors Confidence Index (December 2025)
Who’s Choosing Which Path
The demographics behind these two paths are getting further apart, not closer. NAR’s 2025 data shows the typical home seller is now 64 years old and has owned their home for a median of 11 years — both record highs, up from a typical seller age of 47 back in 2005. All-cash buyers specifically skew even older: NAR found all-cash buyers average 58 years old versus 38 for financed buyers, a 20-year gap driven largely by home equity — older sellers and buyers simply have more built-up equity to deploy without a loan.
In Alabama, that aging-seller pattern intersects with a state that’s actively gaining residents relocating from higher-cost states for a lower cost of living, plus real estate investors and house flippers targeting the state’s older, more affordable housing stock. That combination — long-tenured owners with significant equity, an active buyer pool without much financing pressure, and a below-national-average closing-cost environment — is part of why Alabama supports a genuinely competitive market for both traditional listings and direct cash offers, rather than cash sales being a niche fallback option.
Source: NAR 2025 Profile of Home Buyers and Sellers; U.S. Census Bureau QuickFacts (Alabama Population Estimates, 2025)
Summary Table: Alabama Cash Sale vs. Agent Sale Statistics (2026)
| Statistic | Figure | Source | Year |
|---|---|---|---|
| Alabama typical home value (Zillow ZHVI) | $241,517 | Zillow | 2026 |
| Alabama median value, owner-occupied units (5-yr ACS) | $209,900 | U.S. Census Bureau | 2020-2024 |
| Alabama median sale price, end of year | $325,000 | RealTrends | 2025 |
| Alabama median list price | $324,967 | Zillow | 2026 |
| Alabama median sale-to-list price ratio | 0.986 | Zillow | 2026 |
| Alabama homes selling over list price | 19.1% | Zillow | 2026 |
| Alabama homeownership rate | 70.2% | U.S. Census Bureau | 2020-2024 |
| Alabama population growth since 2020 | +3.3% | U.S. Census Bureau | 2025 |
| Alabama median days on market (start of 2025) | 91 days | RealTrends | 2025 |
| Alabama median days on market (end of 2025) | 84 days | RealTrends | 2025 |
| Alabama listings taking a price cut | 34.65% | RealTrends | 2025 |
| Alabama average realtor commission | 5.96% | ListWithClever/RealEstateWitch | 2026 |
| Alabama average seller closing costs | 3.00% of price | RealEstateWitch | 2026 |
| Alabama average closing costs (ClosingCorp method) | 1.4% of price | Bankrate/ClosingCorp | 2024 |
| National average real estate commission | 5.70% | Clever Real Estate | 2026 |
| Agent-assisted median sale price vs. list price | 99% | NAR | 2025 |
| FSBO sales share of U.S. market | 5% (record low) | NAR | 2025 |
| Agent-assisted sales share of U.S. market | 91% | NAR | 2025 |
| FSBO price gap vs. agent-assisted sales | -$65,000 | NAR | 2025 |
| “We buy houses” investor offer range (% of FMV) | 50%-70% | HomeLight | 2026 |
| 70% ARV rule ceiling on Alabama median value | ~$169,000 | HomeLight calculation | 2026 |
| Full cash-buyer offer range across all buyer types | 50%-95% of FMV | Opendoor | 2026 |
| iBuyer share of U.S. home sales | ~1% | NAR | 2022 |
| iBuyer contract close time | 30 days | NAR | 2022 |
| iBuyer contracts that terminated | 5% | NAR | 2022 |
| Average mortgage purchase closing time | 41 days | HomeLight | 2025 |
| Standard financed closing window | 30-45 days | Multiple (Zillow, Opendoor) | 2026 |
| Cash sale closing window | 7-14 days | Opendoor | 2026 |
| Full traditional sale timeline (list to close) | 65-93 days | Opendoor | 2026 |
| National all-cash purchase share | 28%-29% | Redfin | Dec. 2025 |
| Pandemic-era peak cash purchase share | ~35% | Redfin | Late 2023 |
| Average age, all-cash buyers | 58 years | NAR | 2025 |
| Average age, financed buyers | 38 years | NAR | 2025 |
| Median seller age (2025) | 64 years | NAR | 2025 |
| Median seller age (2005, for comparison) | 47 years | NAR | 2005 |
Frequently Asked Questions
Alabama’s typical home value is $241,517 according to Zillow’s Home Value Index as of mid-2026, up 1.5% from a year earlier. The Census Bureau’s five-year estimate, which includes the full owned housing stock rather than just recent sales, puts it lower at $209,900.
Most “we buy houses” investors follow the 70% ARV rule, meaning offers typically fall between 50% and 70% of fair market value once estimated repair costs are factored in. Technology-driven iBuyers usually pay more, in the 85%-95% range, since they’re competing on convenience rather than maximum resale margin.
A cash sale can close in as little as 7 to 14 days. A traditional agent-assisted sale in Alabama, factoring in the state’s median 84 days on market plus a standard 30-to-45-day financed closing period, commonly takes two to four months from listing to closing.
Alabama’s average combined realtor commission is 5.96% of the sale price, slightly above the 5.70% national average, split roughly between the listing agent and the buyer’s agent.
It depends on what’s being optimized for. Selling for cash trades a lower sale price — typically 50% to 95% of market value depending on the buyer type — for speed, certainty, and no repair or showing requirements. Selling with an agent typically nets a higher price (agent-assisted sales beat FSBO by $65,000 nationally) but takes two to four months and includes commission and closing costs.
Methodology & Sources
This report was compiled by Best Homes & Property Solutions using publicly available data from the U.S. Census Bureau’s American Community Survey and QuickFacts program, Zillow’s Home Value Index and market research pages, RealTrends’ 2026 state market summaries, the National Association of Realtors’ 2025 Profile of Home Buyers and Sellers and Realtors Confidence Index, Redfin’s all-cash purchase reporting, HomeLight’s cash-buyer and closing-cost research, Opendoor’s housing-timeline research, and ListWithClever/RealEstateWitch’s Alabama closing cost data. All figures are attributed to their original source and year; the 70% ARV ceiling applied to Alabama’s median value is a calculation performed for this report using HomeLight’s published methodology, not a stat independently published by any source. Every figure should be independently verified against the linked source before being used for legal, tax, or investment decisions — this report is for informational purposes only.
- U.S. Census Bureau, QuickFacts: Alabama (2020-2024 American Community Survey estimates)
- Zillow Home Value Index, Alabama Housing Market (data through June 2026)
- RealTrends, 2026 Best Real Estate Agents in Alabama — Market Summary
- National Association of Realtors, 2025 Profile of Home Buyers and Sellers
- National Association of Realtors, Realtors Confidence Index (December 2025)
- Redfin, “All-Cash Home Purchases Ended 2025 at Five-Year Low” (2026)
- HomeLight, “What Is the 70% Rule in House Flipping?” and companion cash-buyer research (2026)
- Opendoor, “How Long Does It Take to Sell a House in 2026?” and “Companies That Buy Houses for Cash” (2026)
- Clever Real Estate, 2026 National Real Estate Commission Survey
- ListWithClever / RealEstateWitch, Alabama Seller Closing Cost Report (2026)
- Bankrate/ClosingCorp, Alabama Closing Costs Report (2024)
Thinking about which path is right for your Alabama home? Best Homes & Property Solutions can provide a no-obligation cash offer alongside an expert estimate of what a top local agent could get you — so you’re comparing real numbers, not guesses, before you decide. Contact us today!